
Trade IQ
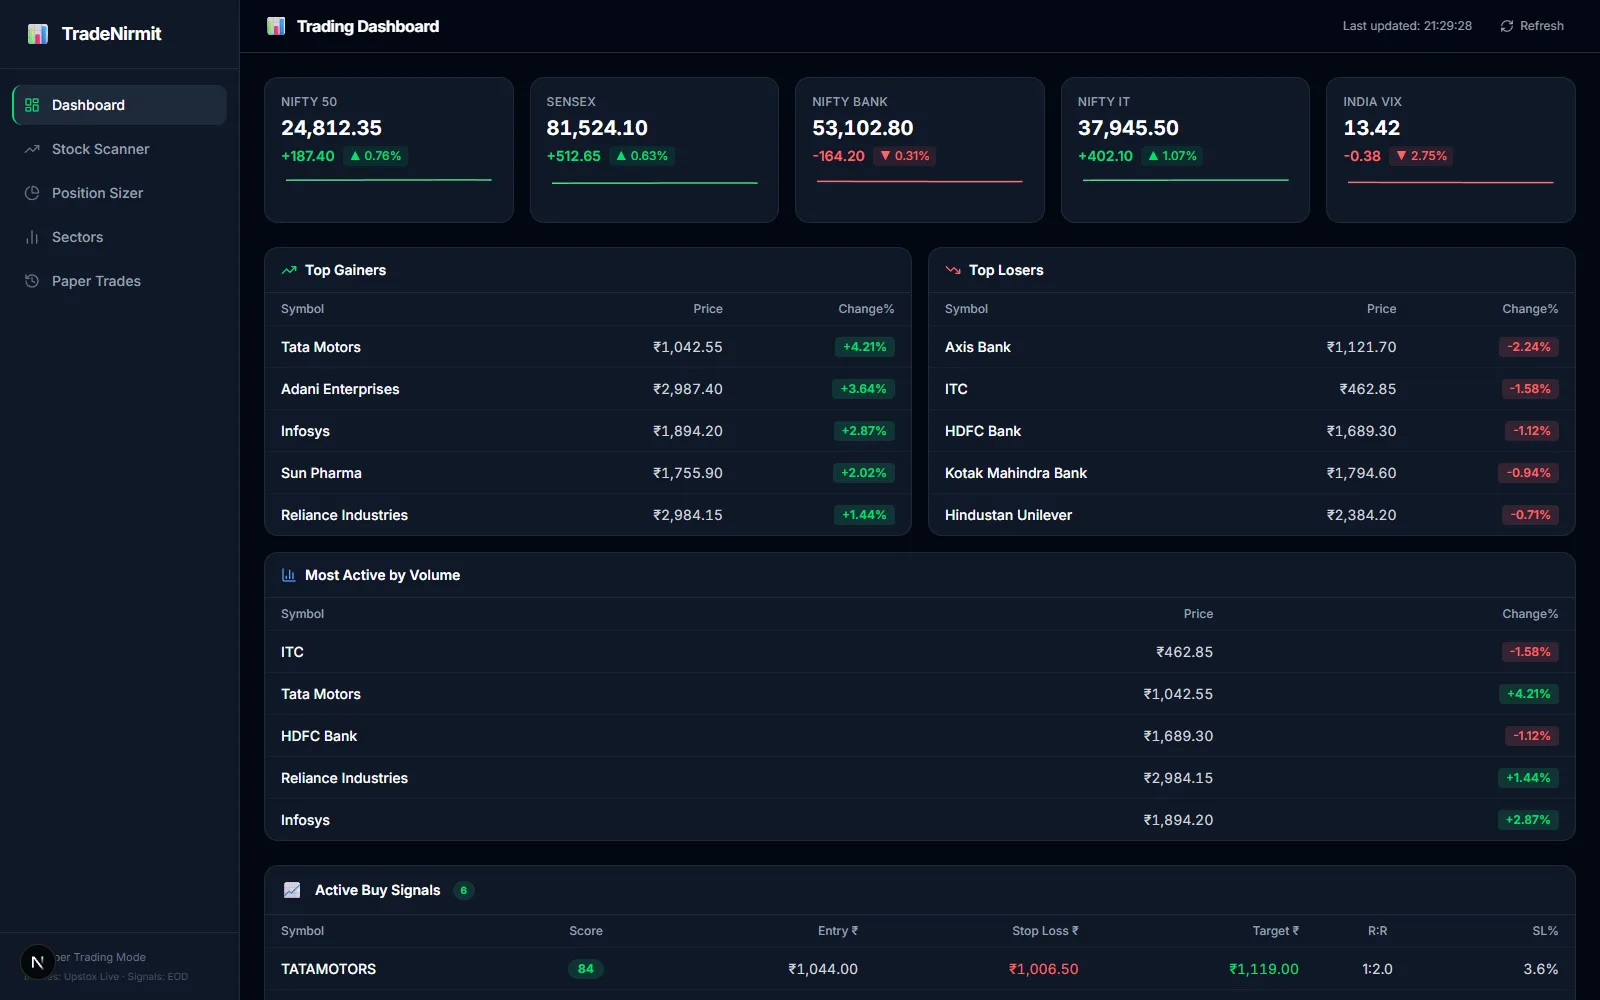
A market dashboard that scans NSE stocks and sizes the position.
- Year
- 2026
- Stack
- Next.jsTypeScriptRechartsFastAPIPythonyfinance
The brief
Self-initiated. Retail traders answer one question every morning — what is worth buying, and at what levels — across five browser tabs. This pulls it onto one screen.
The challenge
The hard part isn't the chart. It's running technical scans over hundreds of tickers without the interface stalling, streaming index prices while someone is reading, and turning a raw signal into levels a person can act on: entry, stop, target, position size.
The approach
A FastAPI service does the scanning in Python and serves a Next.js dashboard. Index prices arrive over server-sent events, so the page updates without a refresh. Every signal carries entry, stop-loss, and target, and a sizer converts those into a share count at fixed 1% risk. We also built a standalone demo mode with realistic sample data so the frontend runs and deploys with no backend attached — that mode is what these screenshots show.
What we built
- Scored signals with entry, stop-loss, and target levels
- Live index feed over server-sent events
- Sector rotation monitor
- Position sizer at fixed 1% risk
- Paper-trading book
What it demonstrates
- A Python analysis backend paired with a typed Next.js frontend
- Streaming data into a live interface without jank
- Dense financial UI that stays readable
- Graceful degradation — the app runs with the backend switched off